Making Sense of the NPV Annuity Table: A Plain-English Guide
30 July 2026
Making Sense of the NPV Annuity Table: A Plain-English Guide
It’s 11:45 PM. You’re staring at a spreadsheet on your laptop, a cup of lukewarm tea sitting untouched beside your keyboard, and your eyes are blurring from rows of numbers. You’ve got a big pension decision to make, or perhaps you're trying to figure out what a multi-year stream of cash flows is actually worth in today's money. Then, you stumbled across a strange grid of numbers labeled an npv annuity table.
It looks like something out of an antique accounting textbook. Columns of decimals, rows of interest rates and time periods, and no obvious starting point for someone who just wants to know: Is this deal actually worth it?
Take a deep breath. Close your eyes for a second. You don't need a finance degree to make sense of this.
What you're looking at isn't a secret code; it's just a shortcut. Once you understand what the table is actually trying to tell you, those intimidating decimals turn into a remarkably clear picture of your financial future. Let's walk through how these tables work, who uses them, and how you can use them to find your footing when a big financial choice has your head spinning.
Why Time Changes the Value of Money
To understand why an annuity table exists at all, we have to start with a fundamental truth of personal finance: a dollar (or pound, or rupee) today is worth more than a dollar ten years from now.
Think about it this way. If someone hands you £1,000 right now, you can invest it, put it in a savings account, or use it to pay down debt that is charging you interest. By next year, that £1,000 has the potential to grow. Conversely, if someone promises to pay you £1,000 ten years from now, inflation will have eaten away at its purchasing power, and you’ve lost a decade of potential growth.
This concept is called the time value of money.
When you're dealing with an annuity—which is simply a series of equal payments made at regular intervals, like a pension payout, a structured settlement, or a fixed retirement income—you aren't just looking at a single lump sum. You're looking at a whole parade of future payments marching toward you year after year.
Calculating the current, real-world value of that entire parade by hand is exhausting. You’d have to discount year one's payment back to today, then year two's payment, then year three's, all the way out to year twenty or thirty, adding them all up.
That is where the table comes to the rescue.
What Actually Is an NPV Annuity Table?
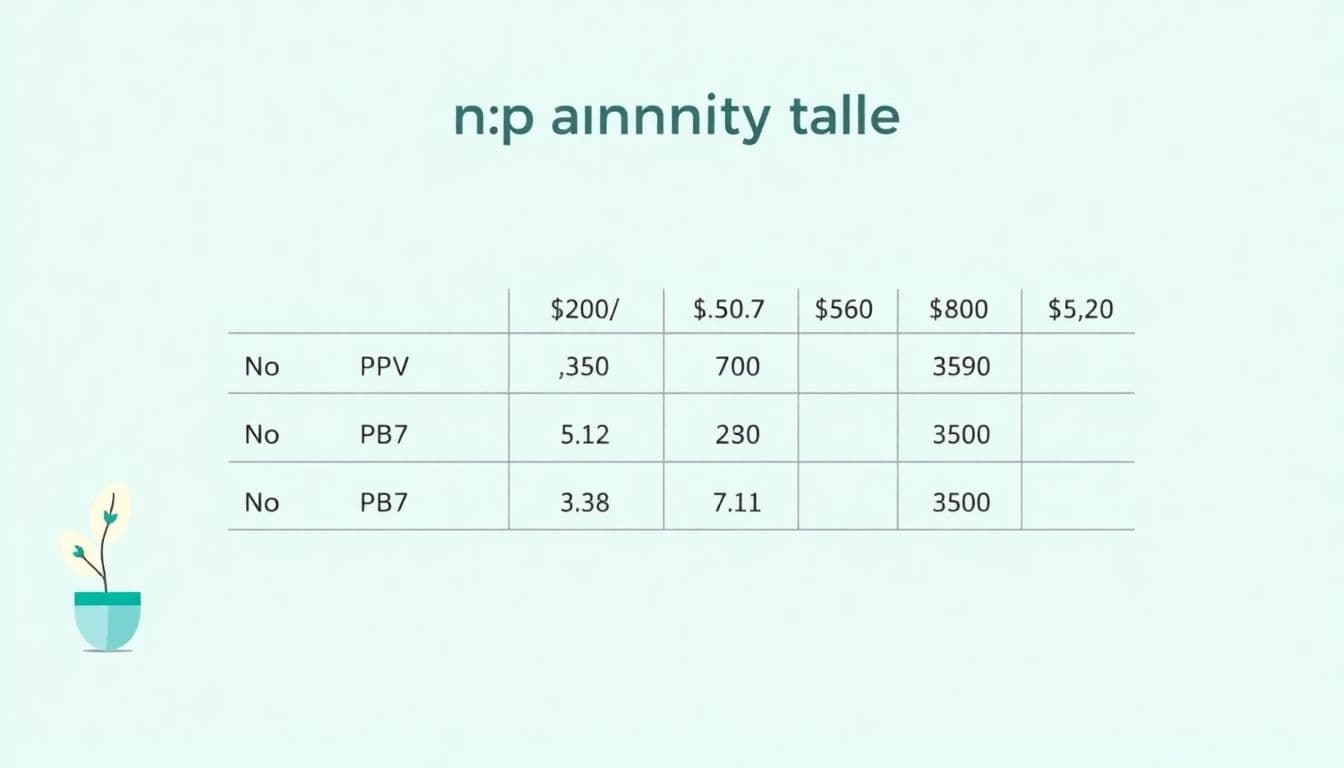
An Net Present Value (NPV) annuity table—often just called a present value of an annuity table—is essentially a cheat sheet compiled by mathematicians so the rest of us don't have to suffer through complex algebra.
Instead of doing the heavy math for every single payment, you look up two things:
- The interest rate (or discount rate) you expect to earn over time.
- The number of periods (usually years) the payments will last.
Where the row and column intersect, you’ll find a single multiplier—a decimal number, usually something between 1 and 20.
To find the total present value of your entire future income stream, you take that multiplier and multiply it by the size of the regular payment.
Payment × Table Factor = Present Value
It’s that simple. Instead of calculating twenty separate future values, you do one single multiplication problem.
A Quick Reality Check on the Terminology
You might hear different names for these tables depending on who you're talking to:
- Present Value of an Ordinary Annuity (PVOA) table: Assumes payments happen at the end of each period (common for standard loans and standard pensions).
- Present Value of an Annuity Due table: Assumes payments happen at the beginning of each period (common for lease agreements or certain types of structured payouts).
For most pension and long-term planning scenarios, you'll be looking at an ordinary annuity table.
Walking Through a Real Decision: Arthur's Pension Choice
Let’s look at a concrete example to see how this works in practice. Meet Arthur.
Arthur is 60 years old and looking at his retirement options. His former employer offers him a choice:
- Option A: Walk away with a single lump sum payout of £150,000 right now.
- Option B: Take a guaranteed pension annuity of £12,000 a year for the next 15 years.
Arthur is scratching his head. On the surface, £12,000 a year for 15 years equals £180,000 total (£12,000 × 15). That sounds higher than the £150,000 lump sum, making Option B look like the obvious winner.
Except... money in the future isn't worth as much as money today. Arthur needs to know the present value of those future payments to make a fair comparison.
He sits down with a financial advisor (or fires up a free digital tool like the NPV Calculator to test different scenarios) and they agree that a reasonable discount rate—representing what Arthur could safely earn if he took the lump sum and invested it—is 5% per year.
Arthur opens up an NPV annuity table. He looks down the left-hand column for the row labeled 15 periods (years), and scans across to the column labeled 5%.
The table gives him a factor: 10.380 (rounded to three decimal places).
Now, Arthur does the math:
- Annual Payment: £12,000
- Table Factor: 10.380
- Present Value = £12,000 × 10.380 = £124,560
The Moment the Numbers Clear Up
Look at what just happened.
While the nominal, face-value total of Arthur's pension payments is £180,000, the actual, present-day value of that income stream—once you account for the time value of money at a 5% discount rate—is only £124,560.
Suddenly, Option A (the £150,000 lump sum) is looking significantly more attractive than it did when Arthur was just looking at raw totals. The table didn't make the decision for him, but it leveled the playing field, letting him compare apples to apples.
If Arthur's expected investment return was lower—say, 3%—the table factor would be higher (around 11.938), making the present value of the pension £143,256, which brings the two options much closer together.
Where People Get Tripped Up: Common Mistakes
Using an annuity table looks easy on paper, but real life is messy. Here are the traps that catch people off guard when they try to apply these tables to their own finances.
1. Picking the Wrong Discount Rate
This is the big one. The discount rate isn't just a random number you pull out of a hat. It represents your opportunity cost—what you realistically could do with that money if you had it right now.
If you pick a discount rate that's too low, you artificially inflate the value of future payments. If you pick a rate that's too high, you make future cash flows look worthless. When in doubt, base your discount rate on conservative, reliable benchmarks like prevailing government bond yields or low-risk index fund historical returns, rather than optimistic stock market dreams.
2. Ignoring Inflation
Standard NPV annuity tables tell you what future cash flows are worth in today's money, assuming purchasing power stays completely flat. But we know it doesn't.
If your annuity payments are fixed (meaning you get the exact same £12,000 every year for 15 years), inflation will steadily erode what you can actually buy with that money. If your pension includes an annual cost-of-living adjustment (COLA)—say, a 2% bump every year—a standard static table won't quite cut it, and you'll need to adjust your approach or use more advanced modeling.
3. Confusing Years with Frequency
Tables are usually built around periods, which most people assume means years. But what if your annuity pays out monthly?
If you have a 10-year annuity paying monthly, that's 120 periods, not 10. If you try to look up 10 periods on a table meant for annual payments when your cash flows arrive every month, your math will be wildly off. Always make sure your discount rate matches your payment frequency (e.g., dividing an annual rate by 12 for monthly calculations).
Bringing Clarity to Your Own Numbers
When you’re staring down a major financial transition—whether it’s structuring a settlement, evaluating a pension buyout, or planning out a multi-year cash flow for a small business—the sheer volume of future numbers can feel paralyzing.
That’s why tools like the NPV annuity table (and modern digital financial calculators) are so powerful. They take a chaotic, decades-long stream of unknowns and distill them into a single, understandable number you can hold in your hand and compare side-by-side.
You don't have to guess whether a multi-year offer is fair. You don't have to rely entirely on what a sales representative or an employer tells you. By translating future promises into present-day reality, you strip away the illusion of big round numbers and see what things are actually worth.
Take it one step at a time. Write down your payment amounts, pick a realistic discount rate that reflects your actual risk tolerance, find your table factor, and do the multiplication. Once you see that final present value figure, the fog lifts, the decision snaps into focus, and you can move forward with total confidence.
Disclaimer: The concepts and examples discussed above are for educational and informational purposes only and do not constitute formal financial, tax, or legal advice. Every financial situation is unique; consider consulting with a qualified professional before making major financial or retirement decisions.
Frequently Asked Questions
What discount rate should I use if I'm not sure what to pick?
If you're evaluating a personal pension or settlement offer, a common baseline is to look at current high-grade corporate bond yields, long-term government bond rates, or a conservative estimate of a diversified balanced portfolio's return (often between 4% and 7% historically, depending on market conditions). Choose a rate that reflects the return you could safely achieve yourself without taking on wild risks.
Can I use an NPV annuity table if my payments change every year?
No. An annuity table only works for regular streams of equal payments. If your payments fluctuate—for instance, if they start at £10,000 and grow by 3% every year—a standard annuity table won't give you the correct answer. For variable cash flows, you need to discount each individual year's cash flow separately using a standard Net Present Value formula.
Why do higher interest rates make future money worth less today?
Because of opportunity cost. If interest rates (or potential investment returns) are very high, money you have today can grow rapidly. Therefore, a future payment has to be heavily discounted because you are missing out on years of high compound growth. Conversely, in a low-interest-rate environment, money doesn't grow fast on its own, so future payments retain more of their relative present-day value.
Want to run these numbers on the go? Check out the free Finlaa app for quick, clear financial calculations whenever you need them.
Related calculators
Related articles
Certificate Rate Calculator: How to Figure Out Your True Earnings
Loans
Building Depreciation Calculator: How to Figure Out What Your Property Is Actually Losing in Value
Loans
Wedding Price Estimate: The Real Numbers Behind the Big Day
Loans
Moving Cost of Living Calculator: See If Your Next Move Actually Makes Financial Sense
Loans